Articles
Content to accelerate your Data Science learning.
Missing Values: Delete, Impute, or Ignore? What to Do with the Holes in Your Dataset
Blank cells in your dataset can silently ruin your analysis — so how do you decide whether to delete, impute, or ignore them? This article reveals the three hidden mechanisms behind missing data (MCAR, MAR, and MNAR), the practical rule that avoids 90% of errors, and the professional workflow from diagnosis to execution with copy-ready Python code. You'll learn the interview answer that separates junior from senior data scientists and why even the "simple" choice of median over mean can make or break your model in production.
R vs. Python: The Definitive Guide to Choosing Your First Data Language
Stuck choosing between R and Python but spending too long deciding instead of coding? This article frames the dilemma as the difference between a statistician's specialized toolbox and a Swiss Army knife — showing how both languages solve the same data tasks with identical logic, where each shines (R for elegant visualization and advanced stats, Python for machine learning and production), and what interviewers really evaluate when they ask "R or Python?" With copy-ready code in both languages, you'll finally know which one to start with — and how to become the bilingual professional the market fights over.
Basic Web Scraping: How to Extract Data from Websites Automatically with Python (BeautifulSoup)
Never manually copy-paste 200 product prices into a spreadsheet again — that's the painful problem web scraping solves, with your "employee" that reads entire pages in milliseconds and pulls exactly the data you need. You'll learn the two-step flow (download with requests, parse with BeautifulSoup), how to locate any data point using Inspect Element as your map to the HTML, and the three methods that cover 90% of use cases — find_all(), find(), and get_text(strip=True). Copy-ready code shows you how to go from raw HTML to a clean pandas DataFrame in under ten lines, plus the responsibility rules every scraper must follow (robots.txt, never overloading a server) and the ethical answer that makes candidates stand out in interviews. Whether you want to monitor competitor prices or gather public data, this read gives you your first weapon in the data scientist's Swiss Army knife — with a hands-on exercise to build that skill.
Git and GitHub for Data: How to Version Your Projects and Not Lose Your Code When Your PC Crashes
Git might be the most important skill on any data professional's resume, and this article explains why using that painfully familiar mess of report_final_v2_EDITED.docx files — multiplied by 40 code files, three teammates, and a PC that could die at any moment. You'll master the three concepts of your everyday workflow (commit, push, pull), learn the exact commands to protect your first repository, and pick up the two habits that separate beginners from pros (a proper .gitignore and clear commit messages) — plus the interview question that eliminates candidates on the spot. Whether you're tired of losing work to crashes or want a portfolio that proves your skills, this read gives you a 15-minute path to a versioned, backed-up, cloud-hosted repo — and coding like a professional.
Virtual Environments (venv/conda): Why They Save Lives and Prevent "It Works on My Machine"
Virtual environments are the single most underrated skill in a data scientist's toolkit, and this article explains exactly why through a memorable apartment analogy: just as each roommate needs their own doorknob, each Python project needs its own isolated space to avoid the dreaded "it works on my machine" disaster. You'll learn the critical difference between venv (lightweight, built into Python) and conda (robust, handles non-Python dependencies like C libraries), walk through the complete lifecycle of creating, activating, installing, and freezing dependencies in both tools, and understand why requirements.txt and environment.yml are the real heroes that make your work reproducible across any machine. The article also reveals the interview answer that instantly separates team players from solo learners — and gives you a 10-minute hands-on ritual to turn environment management into a muscle memory habit you'll use in every single project from now on. Whether you're tired of mysterious AttributeError messages that appeared overnight, preparing to collaborate on a real team, or simply want to stop breaking your own projects every time you install a new library, this read will give you the clarity to isolate, version, and reproduce your work like a professional.
Jupyter Notebooks vs. VS Code: Which Development Environment Should You Choose to Get Started?
Jupyter Notebooks and VS Code aren't rivals — they're two halves of the same professional workflow, and knowing when to switch between them is what separates amateurs from real data practitioners. This article breaks down the fundamental difference through a vivid kitchen analogy (Jupyter as a test kitchen for tasting and adjusting, VS Code as a professional restaurant kitchen for serving complete dishes), explains the mental model the entire market follows — explore in Jupyter, build in VS Code — and walks you through side-by-side code examples that show how the same analysis transforms from a messy notebook of experimental cells into a clean, reproducible .py script. You'll learn why companies never put notebooks in production, discover the two interview signals that reveal whether a candidate has real workflow maturity, and get a 20-minute hands-on migration exercise that will teach you more about the difference between exploring and building than ten hours of passive tutorials. Whether you're setting up your first data project, preparing for technical interviews, or simply confused about which tool to open when, this read will give you the clarity to use both environments with purpose — and the confidence to explain exactly why.
SQL for Data Science: The 5 Queries That Solve 80% of Your Day
SQL is the backbone of every data project — and mastering it doesn't require memorizing hundreds of commands. This article breaks down the five essential queries that solve 80% of a data scientist's daily work through a vivid warehouse analogy, explains the mental order that prevents 90% of beginner mistakes (SELECT → FROM → WHERE → GROUP BY → ORDER BY → LIMIT), and walks you through real e-commerce examples that show exactly how to filter, aggregate, and join tables like a pro. You'll learn the critical difference between WHERE and HAVING that trips up every interview candidate, see side-by-side SQL code for revenue analysis and customer ranking, and discover why SQL remains the single fastest ROI skill in data — more requested than Python in most job postings. Whether you're preparing for your first data interview, trying to extract insights from a production database, or simply tired of waiting for colleagues to pull data for you, this read will give you the reflex to write clean, efficient queries and a hands-on SQLite exercise you can complete in 15 minutes to lock in the concepts for good.
Pandas vs. Polars: The Evolution of Data Manipulation in Python (and When to Use Each One)
Pandas has ruled Python data manipulation for over 15 years — but Polars is rewriting the rules. This article breaks down the fundamental differences between the two libraries through a vivid hardware store analogy, explains Polars' three killer features (Rust-powered speed, automatic parallel processing, and lazy evaluation), and shows you exactly when to reach for each one. You'll compare side-by-side syntax for filtering, grouping, and aggregating data, learn the two entry doors to Polars' lazy mode (.lazy() vs scan_csv), and discover why mastering both tools — and knowing why each exists — is becoming the new baseline for data professionals. Whether you're preparing for your next technical interview, optimizing a production pipeline that's choking on millions of rows, or simply curious about what's replacing the DataFrame you've used for years, this read will give you the judgment to choose the right tool for the right scale — and a hands-on benchmark you can run in minutes to see the speed difference with your own eyes.
The Curse of Dimensionality: Why Giving More Information to the Model Sometimes Makes It Dumber
The more features you add, the smarter your model becomes — right? Wrong. This article unpacks one of the most counterintuitive phenomena in machine learning: the Curse of Dimensionality, where adding columns doesn't enrich your model but instead scatters your data into cosmic dust, making every point equidistant from every other and rendering distance-based algorithms like KNN completely blind. Through a vivid "lost keys in a 100-room house" analogy and a Python experiment you can run in minutes, you'll witness firsthand how the max/min distance ratio collapses from 300x in 2 dimensions to just 1.5x in 500 — and learn why senior data scientists obsessively prune features instead of piling them on. Whether you're preparing for a technical interview, fighting overfitting in production, or simply tired of models that perform worse as you feed them more data, this read will rewire how you think about the relationship between information, space, and learning.
Data Types: Numerical, Categorical, Ordinal — Why the Machine Needs You to Organize the House Before It Walks In
Before a single model is trained, there's a silent gatekeeper that decides whether your project will succeed or fail: data types. This article unpacks the three fundamental categories — numerical (discrete and continuous), categorical (nominal and ordinal) — through a vivid pantry analogy and shows why treating an ordinal variable as numerical can teach your algorithm that "doctor is twice as much as engineer." You'll run a Python snippet with pandas that demonstrates how the same dataset produces radically different results depending on how you respect (or ignore) the nature of each column, and learn the silent discipline that separates senior data scientists from beginners: classifying every feature before modeling. Whether you're preparing for a technical interview, cleaning your first dataset, or just tired of models that learn nonsense, this read will rewire how you think about the raw material of machine learning.
The Mystery of the P-Value: What It Really Means and Why We Shouldn't Trust It Blindly
The p-value is one of the most powerful — and most misunderstood — tools in a data scientist's arsenal. This article demystifies it through a courtroom analogy, exposes the four most common misinterpretations that even experienced analysts make, and reveals why the 0.05 threshold is a human convention, not a law of nature. You'll run a Python simulation that proves how false positives emerge even when there's no real effect, uncover the silent epidemic of p-hacking in automated dashboards, and learn the senior-level mindset that separates those who blindly trust the number from those who understand what it truly means in a business context. Whether you're preparing for a technical interview, designing experiments, or simply tired of misusing statistical significance, this read will fundamentally change how you approach hypothesis testing.
A/B Testing: From "I Think" to "We Know" — The Scientific Method That Powers Every Digital Decision
From Netflix testing Robin Williams vs. Matt Damon posters for Good Will Hunting to Google experimenting with 41 shades of blue, A/B Testing is the silent engine behind every major digital decision. This article takes you from the core concept — null hypothesis, p-value, and statistical significance — to the most common beginner trap: stopping the test too early (peeking), which artificially inflates false positives. You'll run a Python simulation with scipy.stats to see firsthand how sample size determines whether a 2% difference is a real insight or just noise, and learn the senior-level answer that separates average analysts from great ones in technical interviews. Whether you're optimizing click-through rates, pricing, or UX, this is the scientific method that turns "I think" into "we know."
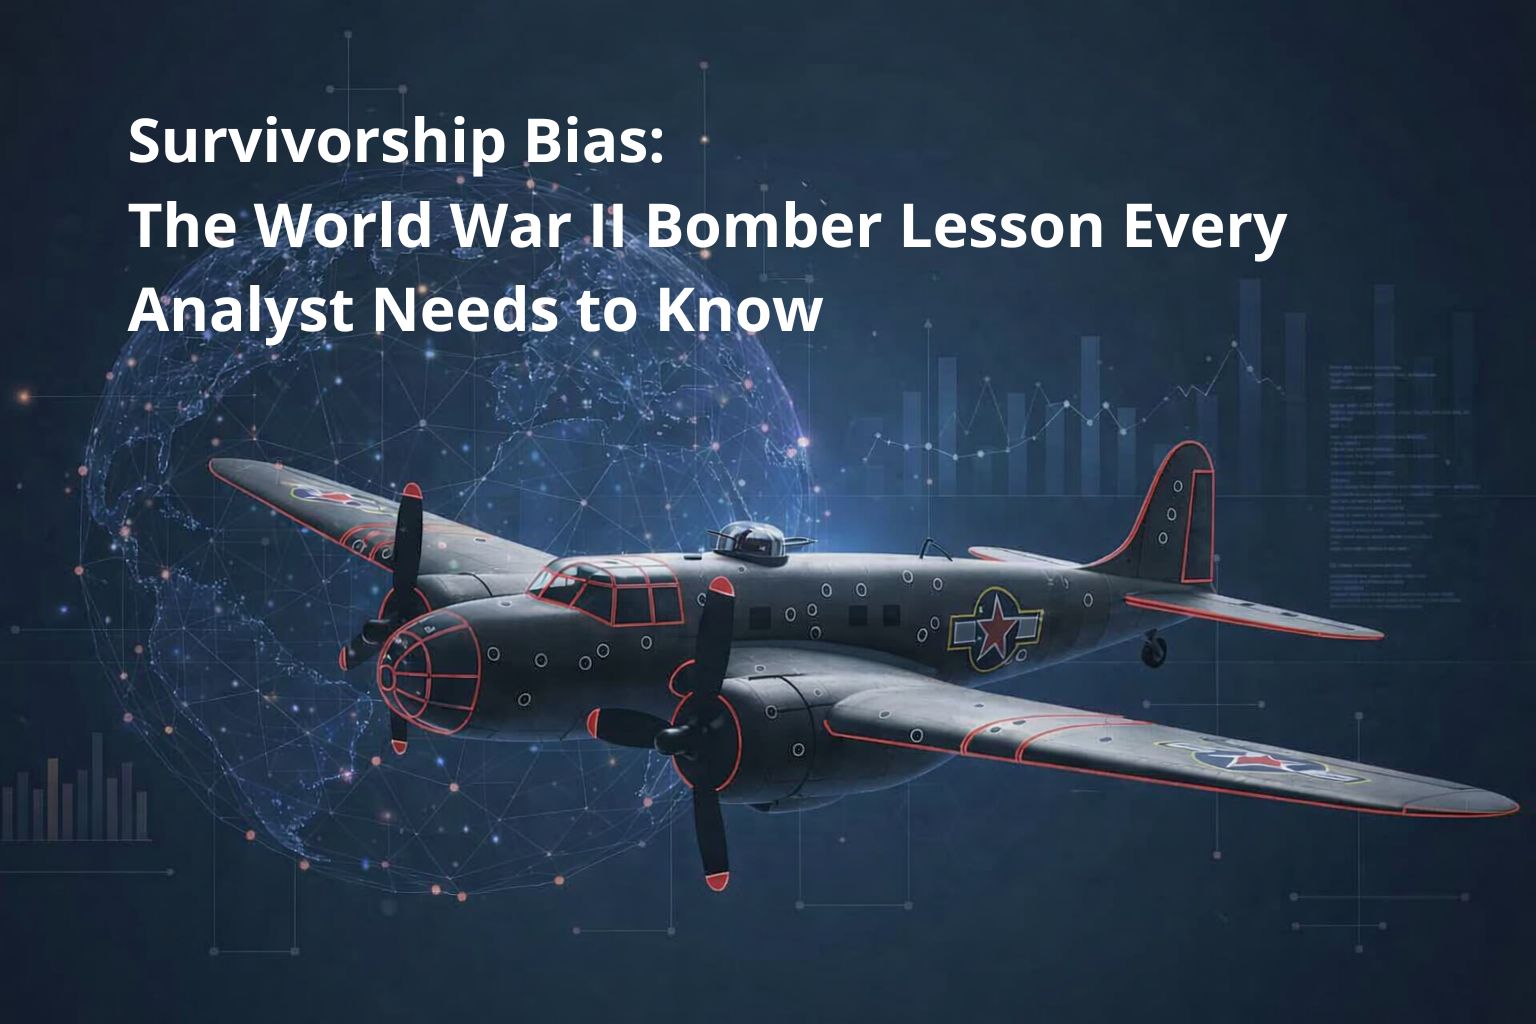
Survivorship Bias: The World War II Bomber Lesson Every Analyst Needs to Know
In 1943, engineers studied bullet holes on returning bombers and wanted to armor the most damaged areas — until Abraham Wald revealed the fatal flaw: they were only studying the survivors. This article unpacks survivorship bias, one of the most dangerous errors in data analysis, showing how it silently distorts investment returns, churn models, and success stories. You'll run a Python simulation proving how survivorship inflates perceived returns by up to 100% and learn the single question that separates naive analysts from great ones: "who isn't in my data?"
Sampling: How to Interview 1,000 People to Know the Opinion of 200 Million with Precision
Discover how 1,000 randomly selected people can reveal the opinion of 200 million with scientific precision — and why a massive 2.4 million-person survey failed spectacularly in 1936 while a 5,000-person sample nailed the presidential election. This article demystifies the math behind sampling, showing you the surprisingly simple formula that makes it work, a hands-on Python simulation to prove it, and the critical question every data professional must answer: "is your sample actually representative?" Whether you're running A/B tests, customer surveys, or clinical trials, understanding sampling is what separates those who calculate numbers from those who make decisions you can trust.
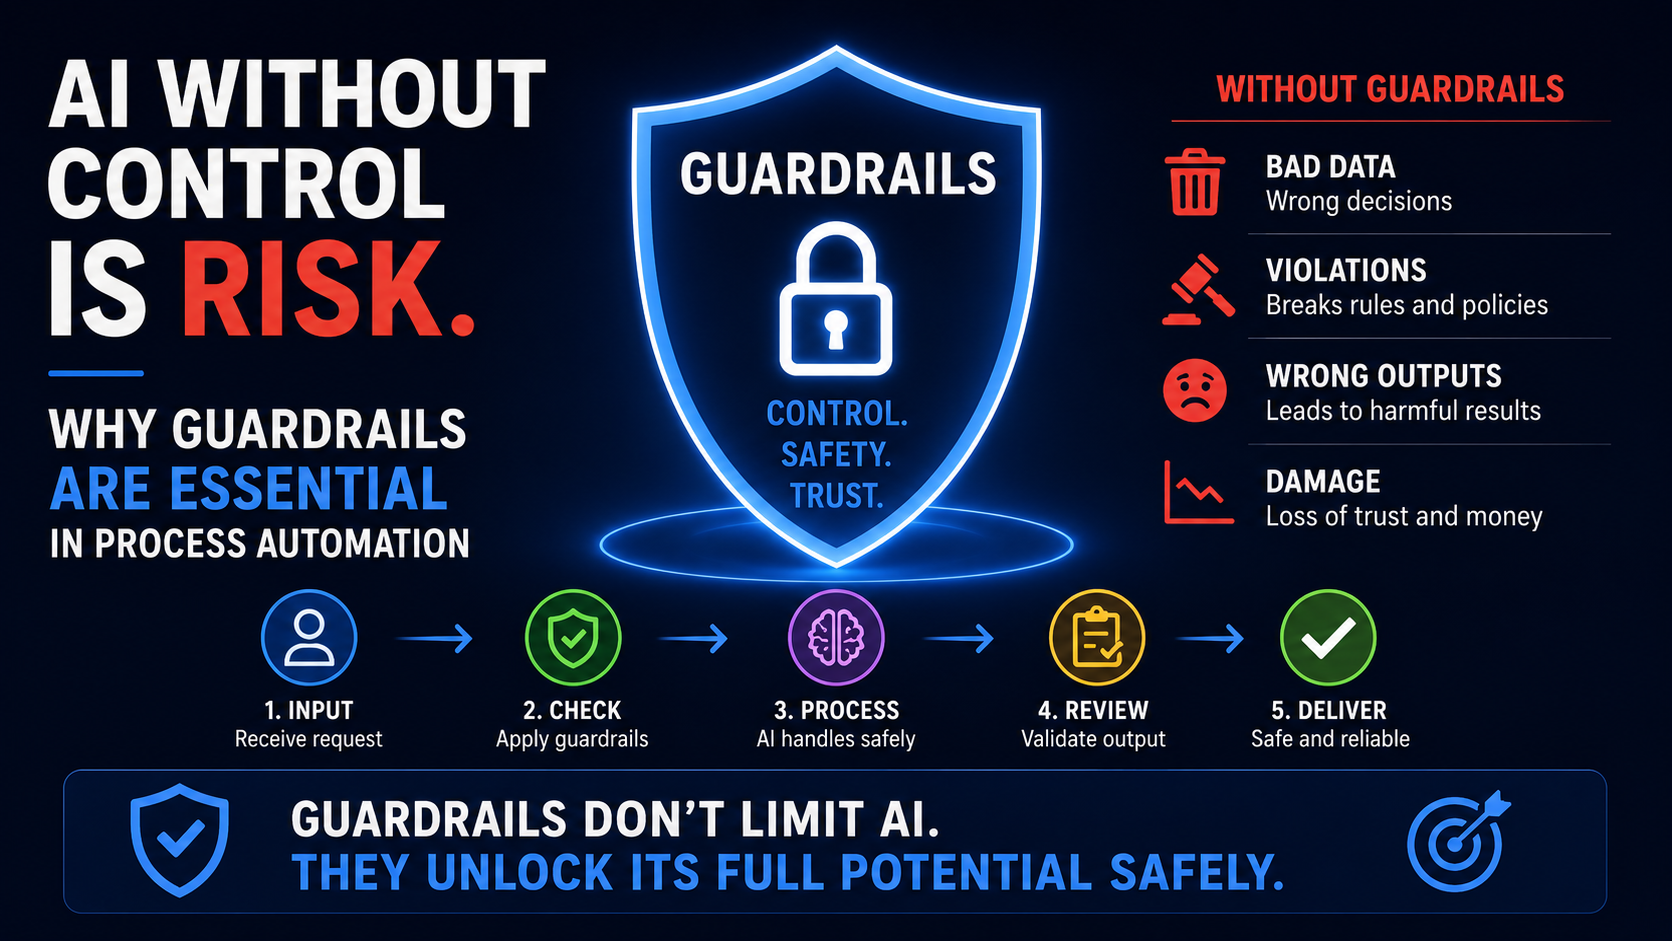
AI Without Control Is Risk: Why Guardrails Are Essential in Process Automation
Discover why AI without guardrails is a business risk you can't afford — from a chatbot that invented a fake refund policy and triggered a lawsuit, to the three critical validation layers (input, domain, and output) that keep AI systems safe in production. This article walks you through practical Python code, real-world scenarios, and the exact mindset that top companies look for in MLOps and AI Engineering roles: understanding that the model is only 20% of the system, and the other 80% is the safety infrastructure around it.
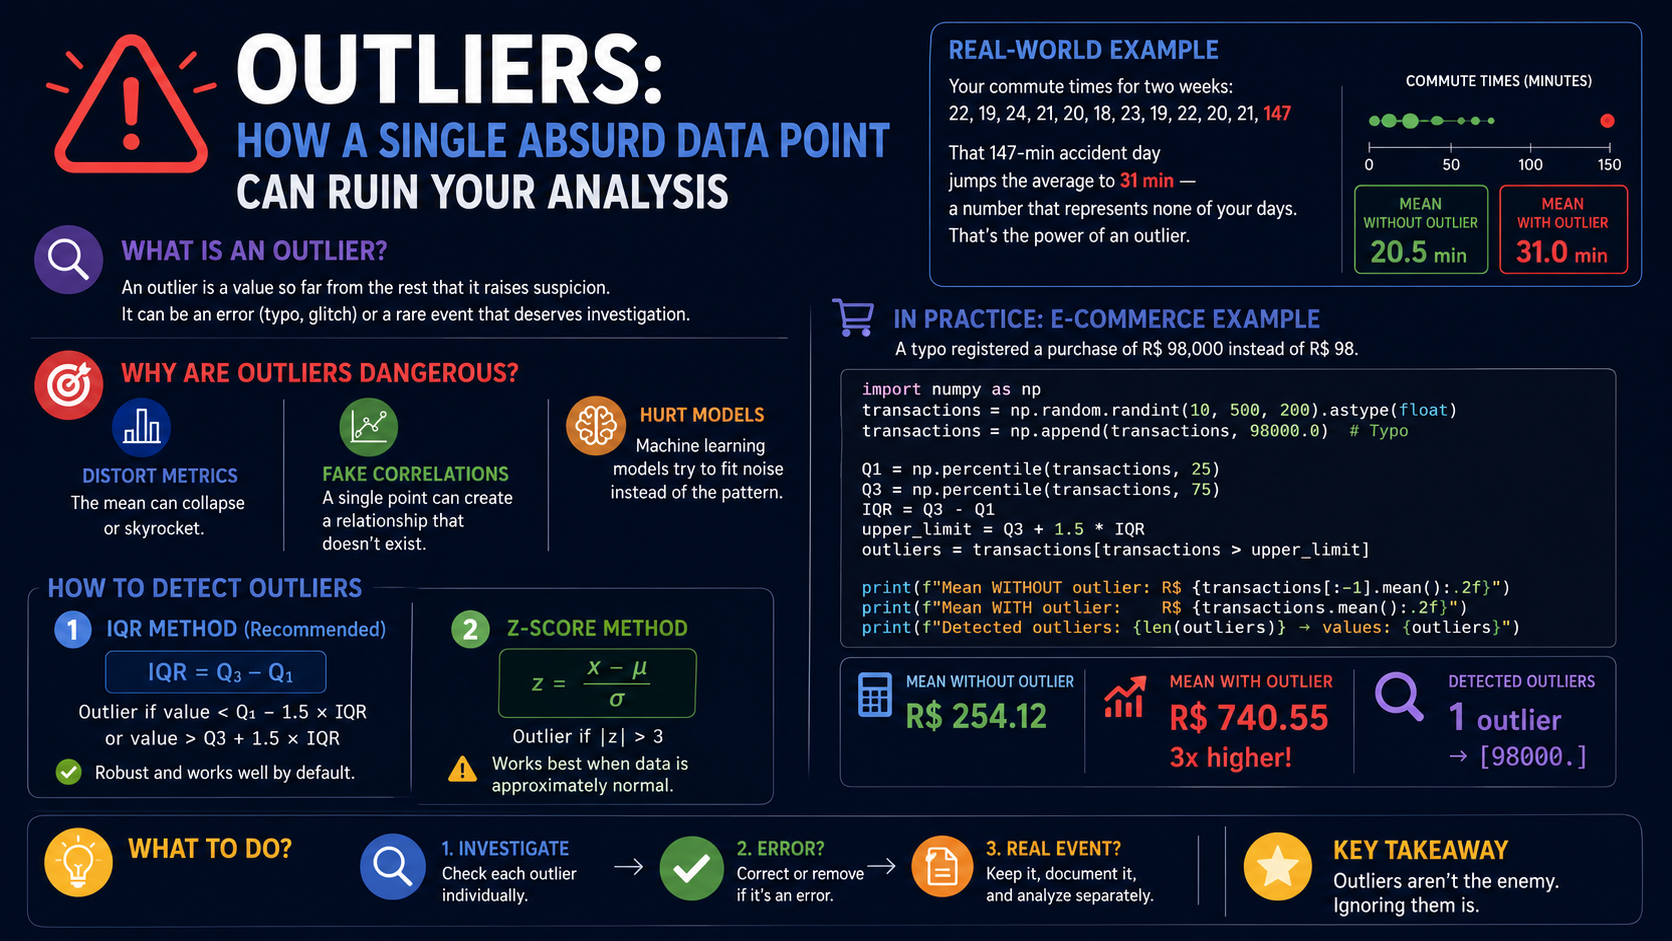
Outliers: How a Single Absurd Data Point Can Ruin Your Analysis
Discover how a single absurd data point can completely distort your analysis — and learn the exact techniques top data scientists use to detect and handle outliers. From the interquartile range method to Z-scores, this article walks you through practical Python code, real-world scenarios across finance, healthcare, and retail, and the critical mindset shift that separates junior analysts from senior professionals: knowing when to delete, when to correct, and when an outlier is actually the most valuable insight in your dataset.

The Normal Distribution: Why the "Bell Curve" Shows Up in Everything
The article explains the normal distribution — the bell curve — showing how it naturally emerges when many independent factors accumulate. It covers the key parameters (mean and standard deviation) and the empirical 68-95-99.7 rule, validated through a simple Python simulation. Beyond theory, it highlights the curve's role in business decisions like A/B testing and anomaly detection, and provides practical guidance for handling non-normal data in real-world scenarios.
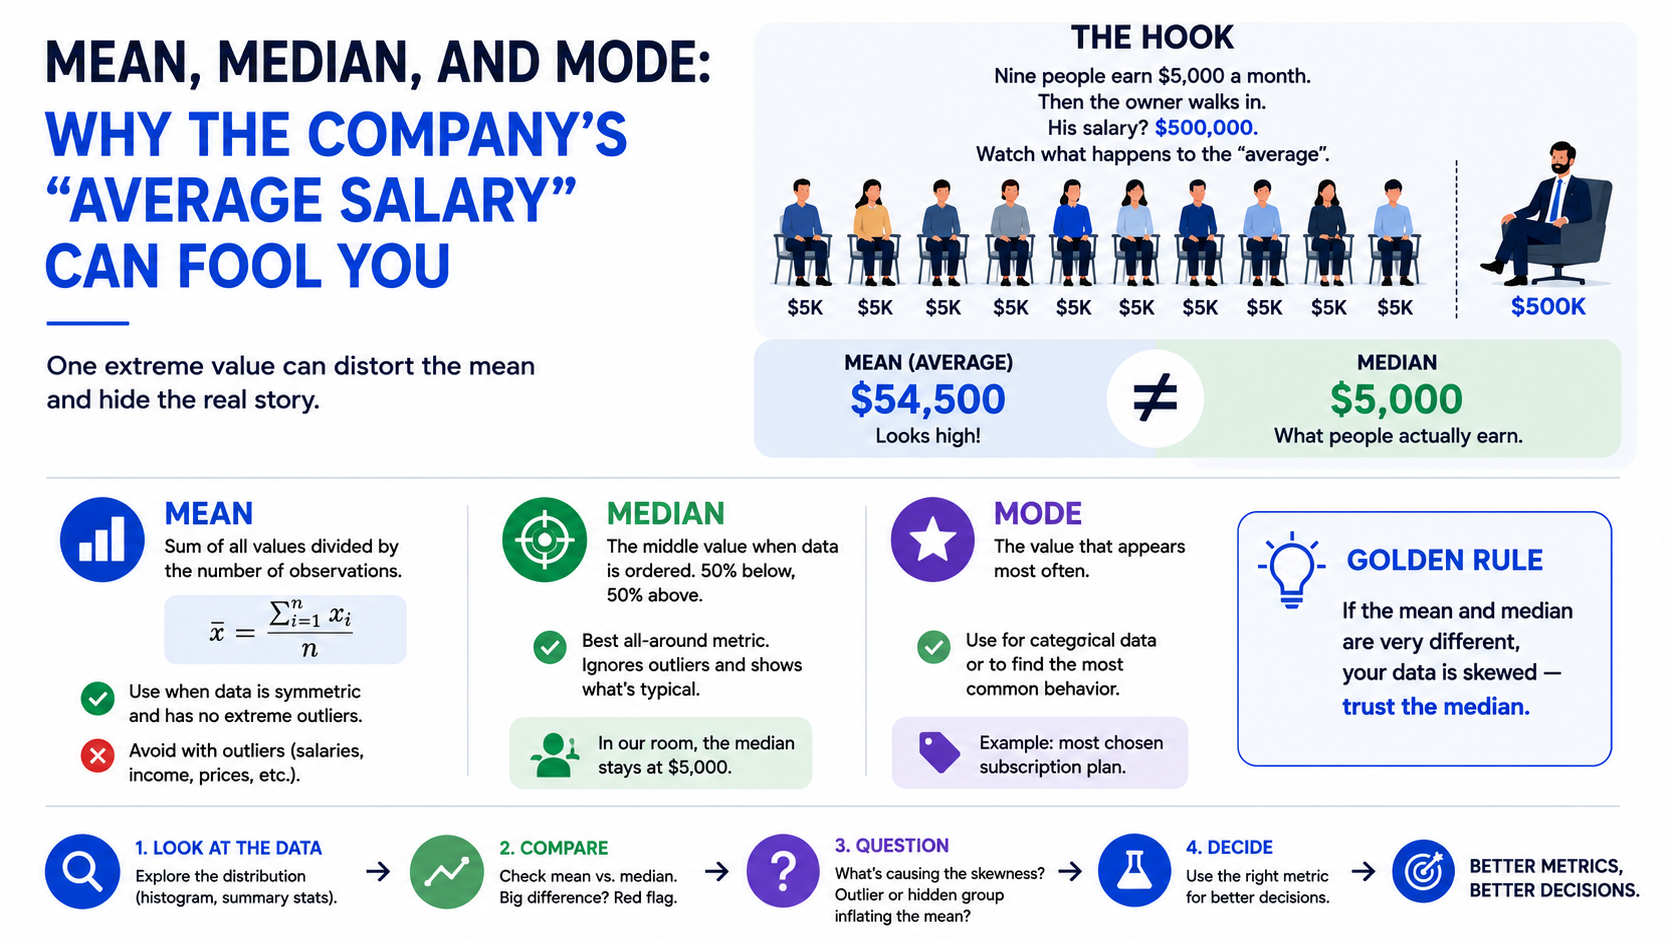
Mean, Median, and Mode: Why the Company's "Average Salary" Can Fool You
The article uses a vivid analogy — nine employees earning $5,000 a month joined by a company owner making $500,000 — to illustrate how the arithmetic mean becomes dangerously misleading in the presence of outliers. It breaks down the three core measures of central tendency (mean, median, and mode), explaining when each is appropriate and establishing the golden rule: if mean and median diverge sharply, trust the median. A practical Python simulation with 50 employees — 48 regular workers and two C-level executives — reveals how a company can honestly advertise an "average salary of $15,000" while half the team actually earns under $8,000, exposing the two-fold gap that serves as a critical red flag for anyone interpreting summary statistics.
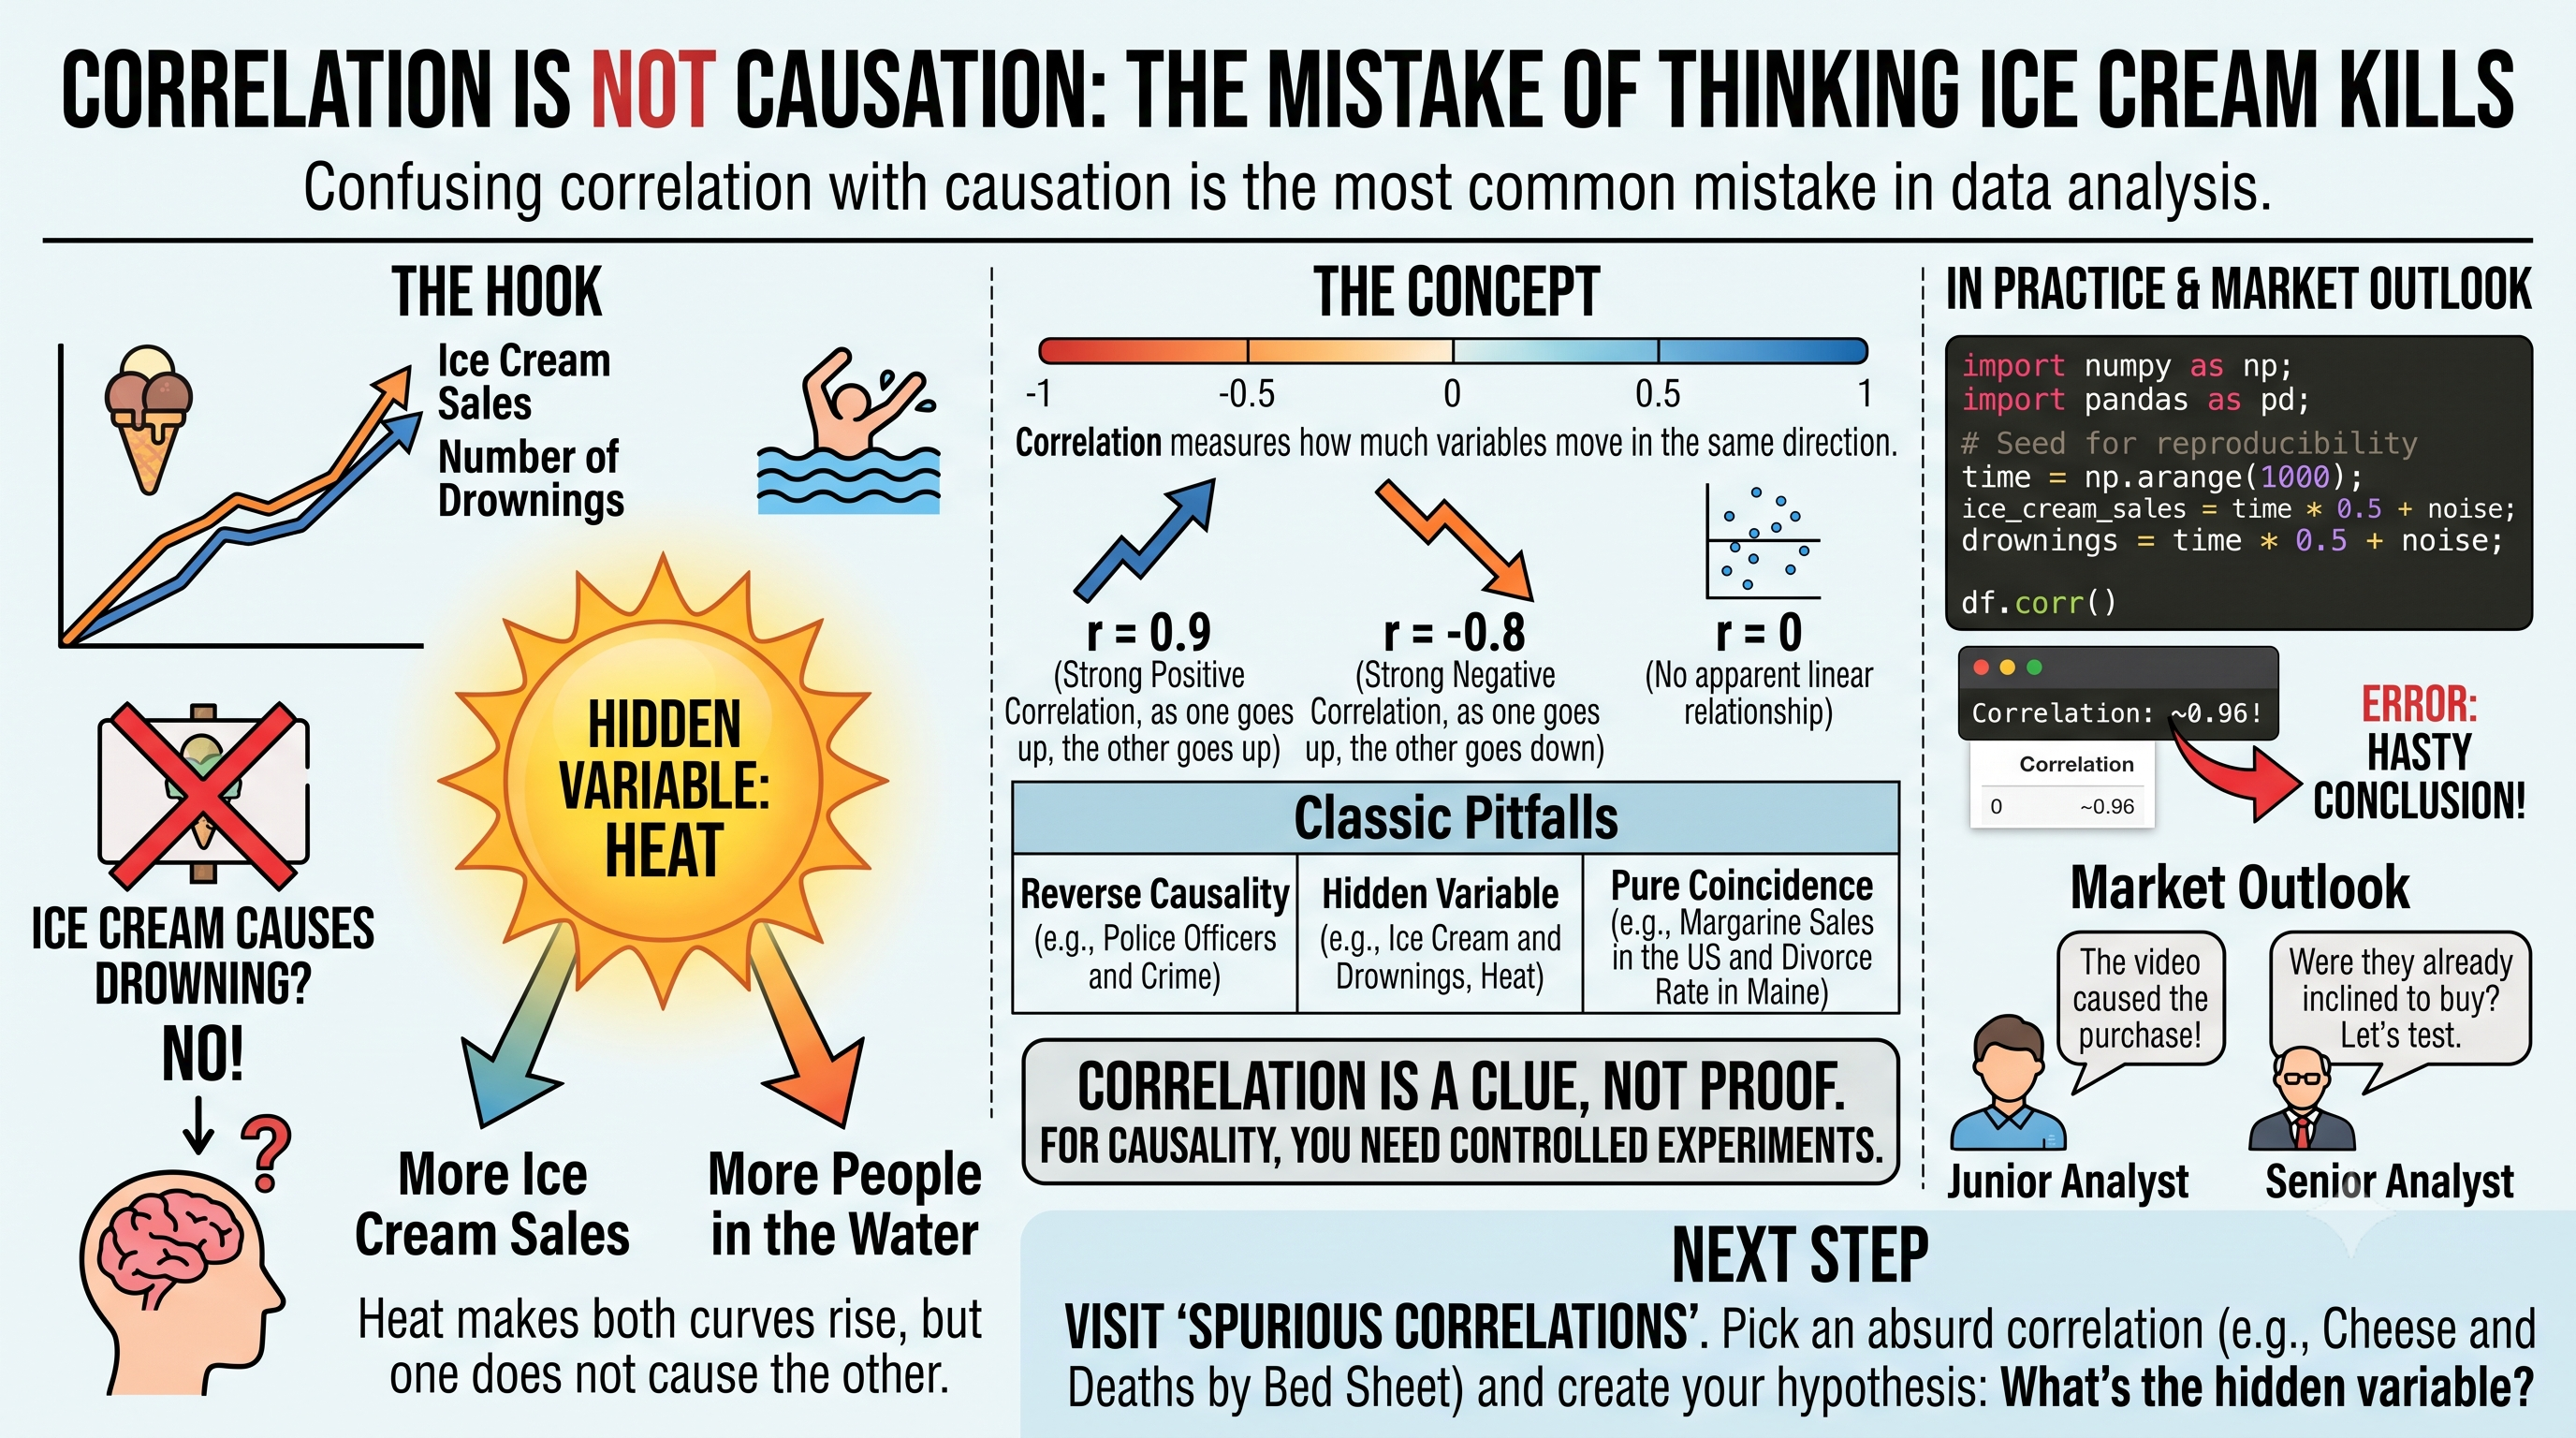
Correlation Is Not Causation: The Mistake of Thinking Ice Cream Kills
The article uses the iconic summer example — ice cream sales and drownings rising together — to illustrate the critical distinction between correlation and causation, warning that human brains are wired to fabricate cause-and-effect stories from mere coincidences. It breaks down three classic traps (reverse causality, hidden confounders, and pure coincidence), demonstrates with Python code how two completely unrelated time series can produce a deceptively strong 0.96 correlation simply because both trend upward over time, and drives home the practical lesson that junior analysts become senior ones the moment they learn to pause and ask "what else could be behind this?" before acting on a correlation — because a clue is never proof.